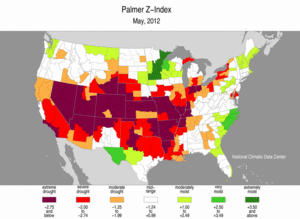
The recent extreme weather conditions beg one to search for more information. Hence, I turned to the U.S. Palmer Drought Indices which consist of three animated charts including short term, long term, and long term cumulative effects of drought and wet conditions. Our area was at a neutral point in May, with not too much or too little rain long term and for our reservoirs and ground water conditions. Is this still the case now in July? Hopefully, in the coming weeks, more rain will head our way.
Explore and see what awaits your area by clicking on this site for the animated charts: http://www.ncdc.noaa.gov/oa/climate/research/prelim/drought/palmer.html

